
THE MARKET BLUEPRINT EXECUTION CLOCK

ASYMMETRIC INTRADAY
TRADING EDGE

Fewer trades. Better locations. Defined times. Built for traders who value precision over prediction.

+5 / +10 / +15PROFIT TARGETS · ES POINTS
67%TARGET 2 WIN RATE
5–7 PTSDEFINED STOP RISK

WHERE TO TRADE

High-probability price areas

  • SUPPORT BUY
  • RESISTANCE SELL
  • TRAP

WHEN TO TRADE

Execution Clock pivot windows

HIGH PIVOTLOW PIVOT

Timing windows, not standalone entry signals.

YESTERDAY'S BLUEPRINTOCT 15, 2026

Subscription products

THE MARKET BLUEPRINT

DAILY FUTURES TRADE PLAN

  • Daily support & resistance levels
  • Bullish & bearish trade setups
  • Higher-time-frame analysis & scenarios

TMB COMMUNITY

LIVE TRADING & EDUCATION

  • Live trading & market discussion
  • Real-time analysis & trade management
  • Education, risk management & mindset

MBEC | AUTOMATED EXECUTION

RULES-BASED AUTOMATION

  • Automated Market Blueprint setups
  • Execution Clock timing integration
  • Configurable entries, stops & targets

THIS WEEK'S SYSTEM PERFORMANCE

TOTAL TRADES0
WIN RATE0%
T1 +5 PTS0%
T2 +10 PTS0%
T3 +15 PTS0%
TRADING DAYS0
OCTOBER 2026
MONTUEWEDTHUFRI

Past performance is not indicative of future results.

THE MARKET BLUEPRINT | EXECUTION CLOCK

HOW IT WORKS.

WHERE Trade + WHEN to Trade = EDGE

Each morning, the Market Blueprint identifies just 3–5 long signals and 3–5 short signals. With 2–4 triggers per day. That's it. The system answers two questions: WHERE to trade and WHEN to trade.
PRICE+TIME+CONFIRMATION→EXECUTION
Cancel Anytime. No Risk.
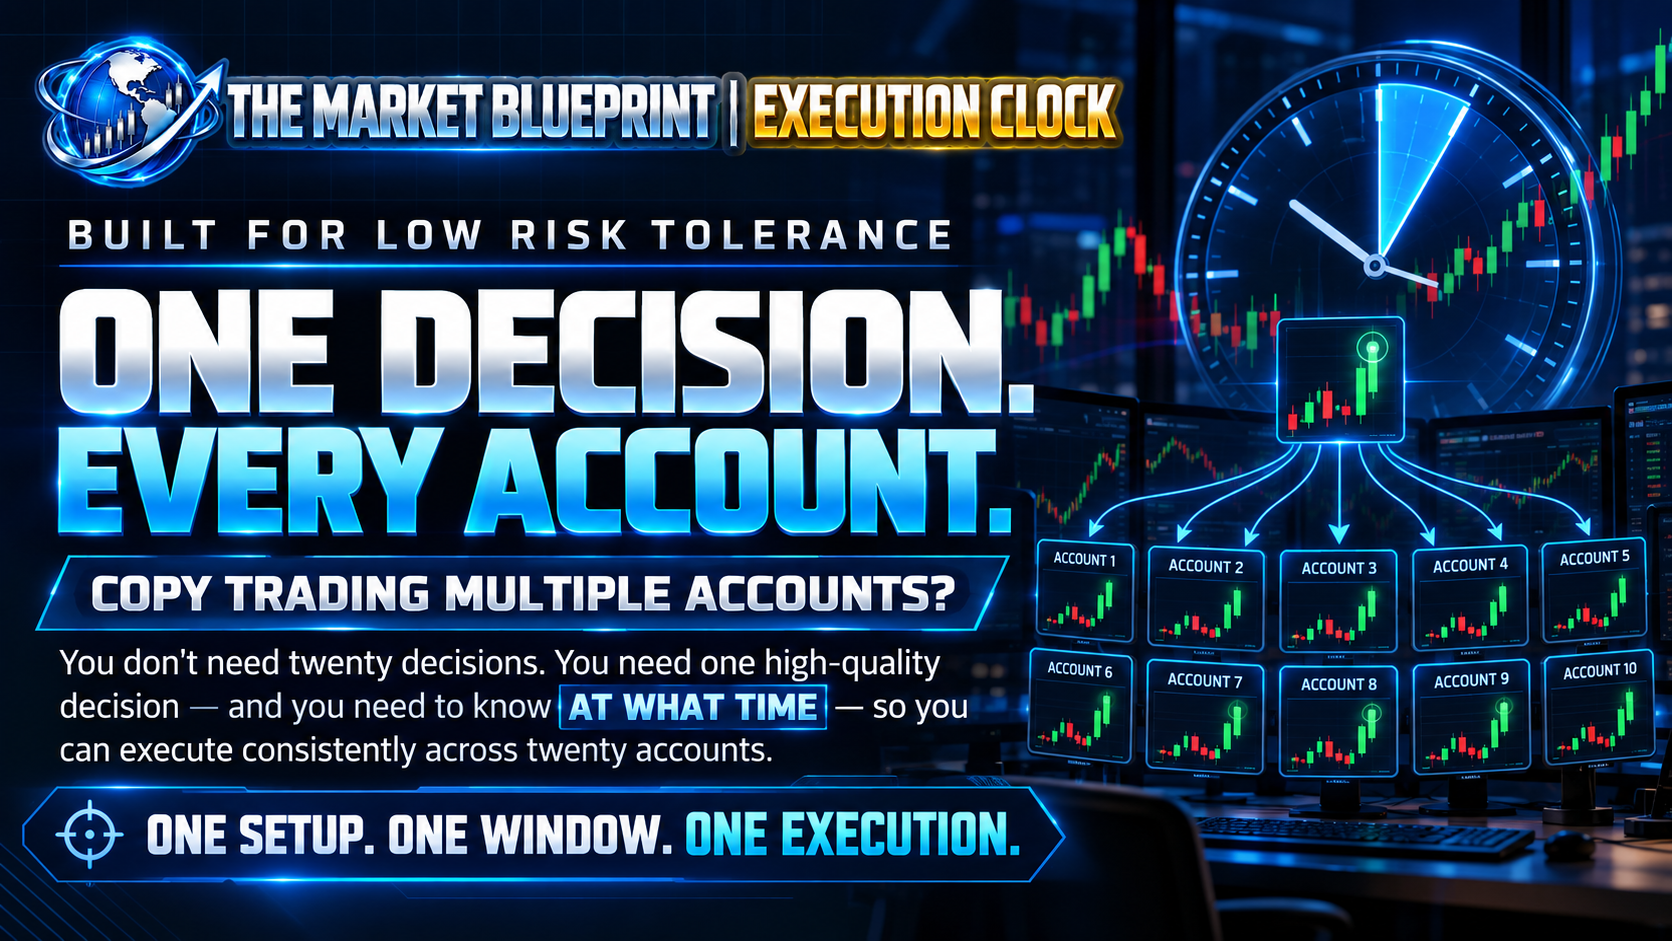
One decision, every account

BUILT FOR LOW RISK TOLERANCE

ONE DECISION.
EVERY ACCOUNT.

COPY TRADING MULTIPLE ACCOUNTS?

You don't need twenty decisions. You need one high-quality decision — and you need to know AT WHAT TIME — so you can execute consistently across twenty accounts.

ONE SETUP. ONE WINDOW. ONE EXECUTION.

THE MARKET BLUEPRINT | EXECUTION CLOCK

THE RESULTS. MONTH BY MONTH.

Published before the bell. Measured against the session's actual highs and lows.

AUGUST 2026

57%

RTH HIGH / LOW CAPTURE

12 of 21 trading days — at least one regular-session high or low was captured by a published Blueprint setup area.

SEPTEMBER 2026

55%

RTH HIGH / LOW CAPTURE

11 of 20 trading days — at least one regular-session high or low was captured by a published Blueprint setup area.

OCTOBER 2026

72%

RTH HIGH / LOW CAPTURE

8 of 11 trading days — at least one regular-session high or low was captured by a published Blueprint setup area.

LATEST RECORDED SESSION

75%

SESSION WIN RATE · OCT 23

4 TRADES · 3W / 1L · WIN RATE 75% · T1 75% · T2 75% · T3 25%

RTH high/low capture measures whether a published setup area contained at least one regular-session extreme. It does not represent a trade win rate or investment return. Past performance does not guarantee future results.

TRADING TOOLS & LICENSING